 By theo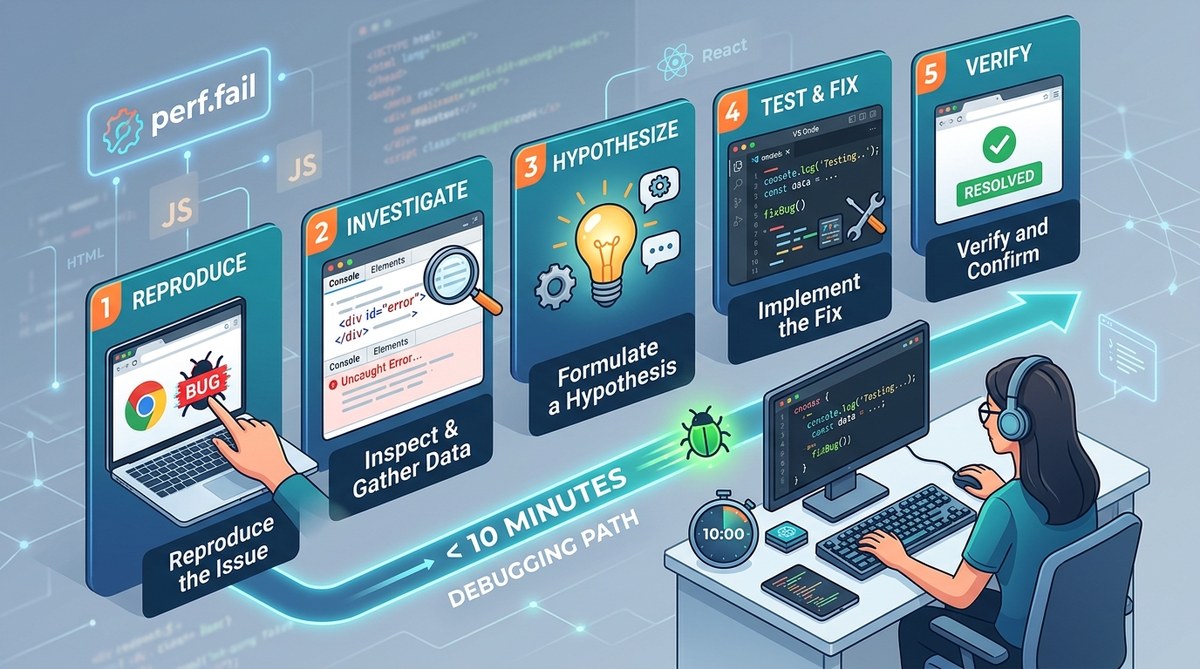
You are staring at a broken CSS layout. The button refuses to change color. Your useEffect runs twice and you have no idea why. Panic sets in. You refresh the page, clear the cache, maybe even restart your machine. The bug remains. Sound familiar? Every frontend developer hits that wall. The difference between a wasted afternoon and a ten minute fix is having a repeatable process. These frontend debugging steps are designed to guide you from confusion to clarity, one clean action at a time.
Debugging frontend bugs quickly requires a structured five step process: reproduce reliably, isolate the scope, read the error message carefully, use developer tools to gather evidence, then apply and verify the fix. When you follow these frontend debugging steps in order, you cut down guesswork and resolve issues in under ten minutes most of the time.
The Five Step Process That Changed How I Debug
I used to jump straight to editing code. That was a mistake. Now I follow five frontend debugging steps in sequence. They work whether you are fixing a React rendering bug, a broken API call, or a weird CSS specificity issue. Let’s walk through each one.
1. Reproduce the Bug Reliably
You cannot fix what you cannot see. Start by making the bug happen on demand. Open your browser, navigate to the page, and repeat the exact actions that trigger the problem. If it only happens sometimes, take notes. Does it appear after a specific click? Does it occur only on mobile view? Jot down the steps. This is the foundation of all frontend debugging steps.
If the bug refuses to reproduce, check these common culprits:
- Different browsers or browser extensions
- Cached files from a previous build
- Network conditions (slow speed, offline)
- User authentication state
Once you can reproduce it at will, you own the bug. Move to step two.
2. Isolate the Scope of the Problem
Now you need to find the boundaries. Ask yourself: is this a component specific issue, a global state problem, or something in between? Use your browser’s element inspector to hover over the broken part. Does the DOM show the right structure? If yes, the issue might be CSS or JavaScript that runs after render.
If the problem involves data, check your network tab. Are the expected API responses coming back? A good way to isolate scope is to comment out parts of the code until the bug disappears. That tells you where it lives.
I often use a binary search approach. Start at the top level component, then split down. This works especially well with React or Vue apps. For more targeted strategies, check out effective techniques for troubleshooting persistent frontend bugs.
3. Read the Error Message (Yes, Actually Read It)
Beginners skip this step. They see a red wall of text and close the console in fear. Don’t do that. Error messages often contain a file name, a line number, and a short description. Copy the message into a text editor if needed. Break it down.
For example, TypeError: Cannot read property 'map' of undefined means you are calling .map() on something that is undefined. That tells you exactly which variable is missing. Read the stack trace, too. It shows the sequence of function calls that led to the error. Follow the trail.
When the error message is cryptic, search for it. Other developers have almost certainly encountered the same one. But before you copy paste a solution, understand why it happened. That is what makes you better at frontend debugging steps.
4. Use Developer Tools to Gather Evidence
Your browser’s DevTools are the most powerful weapons in your arsenal. Open them with F12 or Ctrl+Shift+I. Here is how to use each panel effectively:
| Panel | When to Use | What to Look For |
|---|---|---|
| Console | All the time | Errors, warnings, console.log output |
| Elements | CSS or DOM issues | Styles, computed values, event listeners |
| Network | API or data loading | Status codes, response payloads, timing |
| Sources | JavaScript debugging | Breakpoints, step through code, call stack |
| Performance | Slow rendering or jank | Frame rate, long tasks, layout thrashing |
| Application | Storage or state | LocalStorage, cookies, IndexedDB, service workers |
Set breakpoints in the Sources panel and step through your code line by line. This reveals exactly what values your variables hold at each moment. Combine that with conditional breakpoints to stop only when a condition is true. That saves time.
If you deal with asynchronous code often, the how to debug asynchronous javascript errors without losing your sanity guide can help you avoid the common pitfalls.
“The best debugging step is the one you don’t skip. Always reproduce the bug on the first try. Otherwise you are chasing shadows.” (Senior frontend engineer with 12 years of experience)
5. Apply the Fix and Verify
You found the cause. Now write a fix. But don’t stop there. Apply the change, then confirm the bug is gone. Refresh the page, step through the same reproduction steps. Did it disappear? Good. But also test that nothing else broke. Regression checking is part of any solid set of frontend debugging steps.
Run your test suite if you have one. Manually click through related features. If the fix touches shared state, check other components that depend on that state. Sometimes the smallest change has unintended consequences.
After you verify, commit your code with a clear message. Mention what was wrong and how you fixed it. Your future self (and your teammates) will thank you.
Common Mistakes That Slow Down Debugging
Even with a good process, some habits sabotage your speed. Here is a list of what to avoid:
- Making random changes without understanding the root cause
- Ignoring the console for too long
- Working on a bug you cannot reproduce
- Skipping the network tab when dealing with data
- Using only
console.logand never breakpoints
Each of these wastes time. Instead, stay disciplined with the five frontend debugging steps. If you find yourself stuck, take a step back and re evaluate your assumptions. Sometimes the bug is not where you think it is.
When the Bug Hides Across Environments
Some frontend bugs only appear in production. Your local dev environment uses a different API key, a different build, or a different set of modules. That disconnect is frustrating. The best approach is to simulate production as much as possible locally. Use production like build flags, enable source maps, and test with a similar data set.
If you cannot reproduce the bug locally, add more logging. Ship temporary console.warn statements to production (use a feature flag so you can remove them later). Then examine the logs. Another technique is to use remote debugging tools that capture errors from real users. For a deeper look, read why your production errors don’t show up in local development.
Building Your Own Debugging Toolkit
Over time you will develop preferences. Some people love the React DevTools profiler. Others rely on network throttling to simulate slow connections. The important thing is to have a toolkit that matches the problems you face most often.
Here are a few tools worth adding to your workflow:
- A standalone debugger like Chrome DevTools or Firefox DevTools
- A linter and formatter to catch syntax errors early
- A type checker like TypeScript or Flow to prevent type bugs
- A script that automates reproduction steps (e.g., a Cypress test)
- A bookmarklet that logs all state when a bug appears
Integrate these into your daily routine. They will make frontend debugging steps feel automatic rather than painful.
How to Handle Performance Bugs Differently
Not all bugs break functionality. Some make the page slow. Performance debugging requires a different approach. Instead of looking for crashes, look for long tasks in the Performance panel. Check for layout thrashing, repaint storms, or memory leaks. Use the Memory panel to take heap snapshots and compare them.
Performance issues often stem from inefficient code rather than logic errors. For example, a re render that happens too many times. To tackle these, follow a similar process: reproduce, isolate, gather evidence (using profiler), and fix. The only difference is your evidence comes from performance recordings, not error messages. For more dedicated strategies, see effective strategies to identify and resolve react performance bottlenecks.
The First 60 Seconds Matter
When a bug report arrives, you have one minute to decide your first action. Use it wisely. Open the console immediately. Look for errors. Navigate to the affected part of the UI. If the bug is visual, hover over the element and inspect its styles. This quick scan often reveals the problem without any deep investigation.
If nothing pops up in 60 seconds, start your five step process. Do not panic. Do not start changing code randomly. Trust the process. It has saved me countless hours.
Build Confidence With Each Fix
Every bug you fix teaches you something. Maybe you learn a new DevTools shortcut. Maybe you discover a subtlety of CSS specificity. Maybe you realize your state management pattern is flawed. Treat each debugging session as a learning opportunity.
Over time, you will move faster. The frontend debugging steps become second nature. You will know exactly where to look based on the symptoms. That confidence makes you a better developer and a more reliable teammate.
Now go apply this process. Pick a bug that has been sitting in your backlog. Run through the five steps one by one. You might be surprised how quickly you resolve it.