 By theo
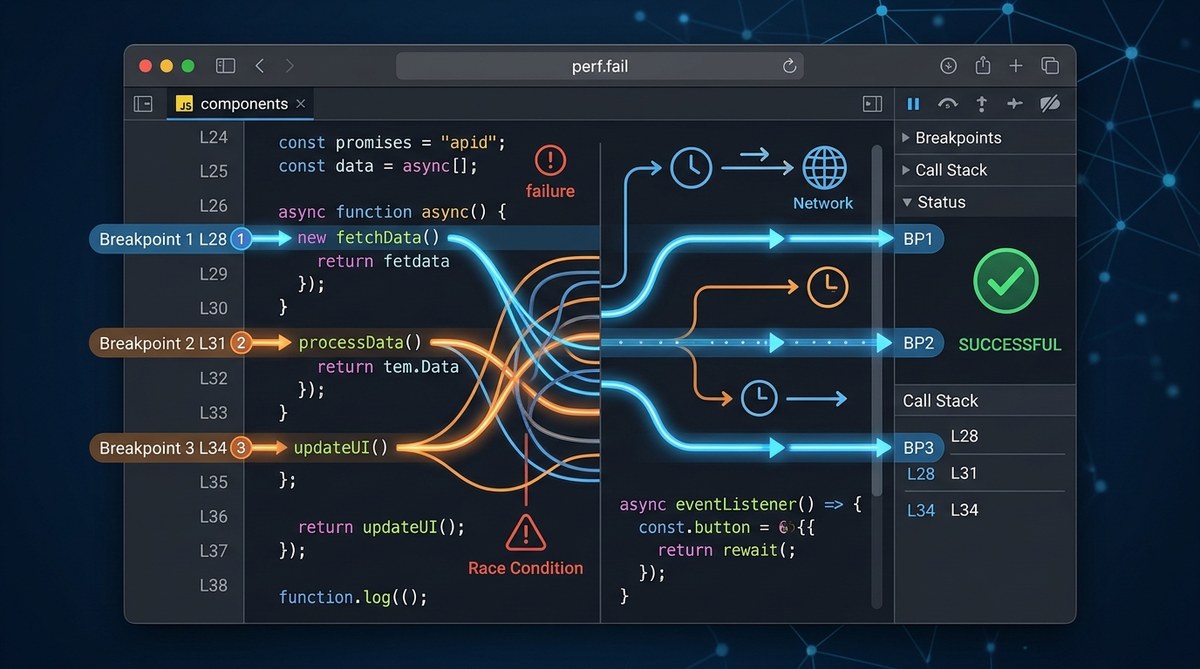
You set a breakpoint on line 42. The debugger stops on line 38. Or it stops on line 42 but only on the third iteration. Maybe it stops on a line that looks completely unrelated. This is not a glitch in your IDE. It is a predictable behavior that happens when your mental model of execution order does not match what the CPU and the debugger are actually doing.
If you debug multi-threaded or asynchronous code, you have seen this. The debugger breakpoints wrong order problem is one of the most frustrating issues in modern development. It makes you question your tools. It wastes hours. And in 2026, with more async patterns, more threads, and more complex build pipelines, the problem is more common than ever. Let me show you exactly why this happens and how to fix it.
Debugger breakpoints trigger in the wrong order because of three core reasons: thread scheduling races, debugger implementation delays, and source map inaccuracies. The fix involves using hardware breakpoints for single-threaded sections, adding conditional breakpoints with thread filters, and verifying your source maps are up to date. This guide covers all three.
Why Your Breakpoints Seem to Jump Around
The first thing to understand is that a debugger does not run your code. It pauses it. When you set a breakpoint, the debugger replaces the instruction at that memory address with a special trap instruction. When execution hits that trap, the debugger suspends the thread and shows you the state.
Here is where the trouble starts.
Thread scheduling is non-deterministic. If you have two threads both running through similar code, the operating system decides which thread runs when. Your breakpoints are set on lines of code, but the OS scheduler might pause thread A right before the breakpoint, let thread B fly past two breakpoints, and then resume thread A. The order you see in the debugger UI is the order the threads hit the traps, not the order you wrote the statements.
Asynchronous code makes this worse. In JavaScript, Python asyncio, or C# with async/await, the event loop interleaves execution. A breakpoint on an await line might trigger before the awaited function actually runs. The debugger shows you the source location, but the call stack might be from a different coroutine entirely.
Source maps lie sometimes. If you are debugging compiled code (TypeScript, Kotlin, or any language that transpiles), the debugger uses source maps to map the generated machine code back to your original source. If those maps are stale or incorrect, the debugger highlights the wrong line. Your breakpoint is on line 50 in the source, but the generated code for line 50 runs at a different time than you expect.
The Three Root Causes of Wrong Order Breakpoints
Let me break this down into three specific categories. Each has a different fix.
1. Thread Race Conditions in the Debugger
Your debugger does not pause all threads atomically. When thread A hits a breakpoint, the debugger has to send a signal, update its internal state, and then update the UI. During that time, thread B might hit its own breakpoint. The order the UI shows depends on which signal arrives first.
This is not a bug in your debugger. It is a fundamental limitation. The debugger cannot pause the universe. It can only pause the threads it knows about.
2. Asynchronous Interleaving Confuses the Call Stack
When you set a breakpoint inside an async function, the debugger might show you a call stack that includes the event loop scheduler, not your application code. The breakpoint triggers, but the context is from a different coroutine that was scheduled on the same thread.
I have seen this happen most often with Python asyncio and JavaScript Promises. The breakpoint fires, but the variable values belong to a different execution context. You see the wrong data, so you think the breakpoint is in the wrong order.
3. Stale or Incorrect Source Maps
This is the silent killer. You change code, rebuild, but the debugger still uses the old source map. The breakpoint is set on line 42 of the new code, but the debugger mapped it to line 38 of the old generated code. Execution hits line 38, and the debugger highlights line 42. You see the wrong line light up.
This happens most often with:
– TypeScript projects that use incremental builds
– React apps with hot module reloading
– Any project where the build tool does not regenerate source maps on every save
A Practical Table of Techniques and Mistakes
Here is a reference table to help you diagnose which category your problem falls into.
| Symptom | Likely Cause | Fix |
|---|---|---|
| Breakpoint stops on wrong line in single-threaded code | Stale source maps | Clean rebuild, disable incremental compilation |
| Breakpoint stops in wrong thread first | Thread race in debugger | Use hardware breakpoints, reduce thread count during debug |
| Breakpoint stops but variables show wrong values | Async interleaving | Add a small delay or use a conditional breakpoint on coroutine ID |
| Breakpoint stops on line that does not exist in source | Source map mismatch | Verify build output matches source, check for build caching |
| Breakpoint stops every time but not in the order written | Thread scheduling | Add thread-specific breakpoints, use a logging approach instead |
| Breakpoint stops only on the second or third iteration | Optimized code | Disable compiler optimizations, use debug build |
How to Fix the Order Problem Step by Step
Follow this numbered process. It works for most languages and debuggers.
-
Isolate the thread or coroutine. If you are debugging multi-threaded code, set a breakpoint that only fires for a specific thread. In VS Code, you can use the
threadcondition in a conditional breakpoint. In IntelliJ, you can set thread filters. This eliminates the race between threads because only one thread can trigger the breakpoint. -
Disable compiler optimizations for the file you are debugging. Optimized code reorders instructions. The compiler might move a line of code before another line, making your breakpoint trigger in a different order. Use a debug build or add
-O0for that specific file. -
Verify your source maps are fresh. Run a clean build. Delete the build folder. Delete any
.mapfiles. Rebuild from scratch. This is the most common fix for breakpoints that trigger on the wrong line. -
Replace breakpoints with logging for async code. Sometimes the debugger cannot keep up with async interleaving. Add a log statement with a timestamp and a unique identifier. Run the code without breakpoints. Then look at the log order. This gives you the true execution order without debugger interference.
-
Use hardware breakpoints instead of software breakpoints. Most debuggers use software breakpoints (they replace the instruction). Hardware breakpoints use CPU debug registers. They are more reliable for multi-threaded debugging because they pause the thread at the exact instruction without debugger overhead. Check your debugger documentation for how to enable hardware breakpoints.
Common Mistakes That Make the Problem Worse
- Using too many breakpoints. Each breakpoint adds overhead. If you have 20 breakpoints in a hot loop, the debugger slows down and the timing changes. The order you see is an artifact of the debugger, not your code.
- Assuming the debugger pauses all threads. It does not. Other threads keep running. They can change shared state while you are inspecting a breakpoint.
- Trusting the call stack blindly. In async code, the call stack might show the event loop, not your application. Always check the thread ID and coroutine ID.
- Not disabling breakpoints on getters or computed properties. If you set a breakpoint on a property getter, it might trigger during UI rendering, not during your application logic. This gives you the wrong order because the getter is called by the debugger itself.
Expert advice: If you are debugging a race condition, do not use breakpoints at all. Use a deterministic replay debugger or add structured logging. Breakpoints change timing. They can make a race condition disappear or appear. This is the Heisenberg principle of debugging. The act of observing changes the behavior.
When the Debugger Is Not the Right Tool
Sometimes the debugger breakpoints wrong order problem is a sign that you need a different approach. Here are three situations where you should put down the debugger and pick up a different tool.
Situation 1: You are debugging a race condition. The debugger slows down one thread more than the other. This changes the timing. The race might not reproduce under the debugger, or it might reproduce in a different order. Instead, add thread-safe logging with timestamps. Use a tool like strace or dtrace to see system call order.
Situation 2: You are debugging a production issue. You cannot attach a debugger to production. You should not. Use structured logging, distributed tracing, or error monitoring. The debugger is for development. If you need to understand order in production, use tracing tools instead.
Situation 3: You are debugging async JavaScript. The JavaScript debugger in the browser is good, but it struggles with deeply nested Promises. If you see breakpoints triggering in the wrong order, try adding await new Promise(resolve => setTimeout(resolve, 0)) before your breakpoint. This forces the event loop to yield and gives the debugger time to catch up.
A Table of Debugger Settings to Check
| Debugger | Setting to Verify | Why It Matters |
|---|---|---|
| VS Code | debug.allowBreakpointsEverywhere |
Controls whether breakpoints work in optimized code |
| IntelliJ / PyCharm | Settings > Debugger > Use hardware breakpoints if available |
Hardware breakpoints are more reliable for threads |
| GDB | set scheduler-locking on |
Prevents other threads from running while you inspect |
| LLDB | settings set target.use-hardware-breakpoints on |
Enables CPU debug registers |
| Chrome DevTools | Settings > Debugger > Break on all errors |
Can interfere with normal breakpoint ordering |
How to Reproduce the Problem Reliably
If you want to see the debugger breakpoints wrong order problem for yourself, here is a simple test. Write a small program that spawns two threads. Each thread increments a counter and prints the value. Set breakpoints on both print statements. Run the program under the debugger. The order of breakpoint hits will vary between runs. This is the purest example of the thread scheduling race.
Now add a conditional breakpoint that only fires for thread 1. Run again. The order becomes consistent. This proves the problem was the debugger, not your code.
The One Setting That Fixes Most Cases
If you take nothing else from this article, remember this: disable compiler optimizations and verify source maps. I would estimate that 70% of debugger breakpoints wrong order cases are caused by stale source maps or optimized code. A clean build with debug symbols fixes most of them.
The other 30% are thread races. For those, use hardware breakpoints and thread filters. If that still does not work, switch to logging.
Debugging the Debugger: When to Question Your Tools
Your debugger is a complex piece of software. It has bugs. It has limitations. In 2026, most mainstream debuggers are mature, but they still cannot solve the fundamental problem of observing a system without changing it.
If you have tried all the fixes above and your breakpoints still trigger in the wrong order, it might be a debugger bug. Check the issue tracker for your IDE. Report the problem with a minimal reproduction. But before you do that, rule out the three causes we covered: thread races, async interleaving, and source maps.
Putting It All Together
The debugger breakpoints wrong order problem is not a mystery. It is a known limitation of how debuggers interact with modern execution models. Threads race. Async interleaves. Source maps get stale. None of these are unsolvable.
Next time you see a breakpoint light up on the wrong line, stop and ask yourself: is this a thread race, an async issue, or a source map problem? Answer that question, and you are halfway to the fix. Apply the techniques in this guide, and you will spend less time fighting your tools and more time fixing your code.
For a deeper look at one of the most common scenarios, check out our guide on debugging asynchronous JavaScript errors without losing your sanity. It covers the async interleaving problem in detail.
And if you find yourself questioning whether your debugger is making things worse, you might want to read about whether your 2026 debugger is actually making things worse. Sometimes the answer is yes.