You just added a console.log('hello') and… nothing. The browser dev tools console stays blank. No error message. No output. It feels like the code is gaslighting you. Rest assured, this is a common frustration for front-end and full-stack developers alike. The reasons are often simple, but they can hide in unexpected places.
When console.log not showing up, start with the dev tools filters: many browsers hide “Verbose” by default. Then check if your code actually runs, especially inside async callbacks or event handlers. Browser extensions, service workers, and overwritten console methods can also block output. This guide walks you through each cause step by step so you can get back to debugging.
Filter Settings Are the Most Common Culprit
The first place to look is the filter bar at the top of your console. Modern browsers default to hiding “Verbose” messages, and a plain console.log falls into that category. You might see only warnings and errors.
Open your console in Chrome or Edge. Look for the dropdown that says “All levels” or “Default levels”. Make sure Verbose is checked. In Firefox, click the gear icon and enable “Log”.
Here is a table that shows the default log levels and what they show:
| Log Level | console method |
Default visible? |
|---|---|---|
| Verbose | console.log(), console.debug() |
Usually hidden |
| Info | console.info() |
Visible in most browsers |
| Warnings | console.warn() |
Visible |
| Errors | console.error() |
Visible |
If you only see errors and warnings, switch to “All” or “Verbose” and your console.log messages will appear.
Check if Your Code Actually Runs
A console.log statement that never executes will never show. Sounds obvious, but it happens more than you think.
- Did you wrap the log inside a condition that returns
false? - Is the script file loaded after the DOM event you are listening for?
- Did you mistype the variable name and cause a ReferenceError before the log line?
Add a simple console.log('I am here') at the very top of your script file. If that does not appear, your file is not loaded at all. Check the Network tab for a 404 or a CORS error.
Browser Extensions Can Block Logs
Some privacy or ad-blocking extensions alter the console. They can override console.log to suppress output when a page uses tracking or analytics. Try opening your page in an Incognito window with all extensions disabled. If logs appear there, you have found the culprit.
Common offenders include:
– uBlock Origin (in advanced blocking mode)
– NoScript
– Privacy Badger
– Developer tool themes that filter logs
You can also test by disabling extensions one by one in your normal profile.
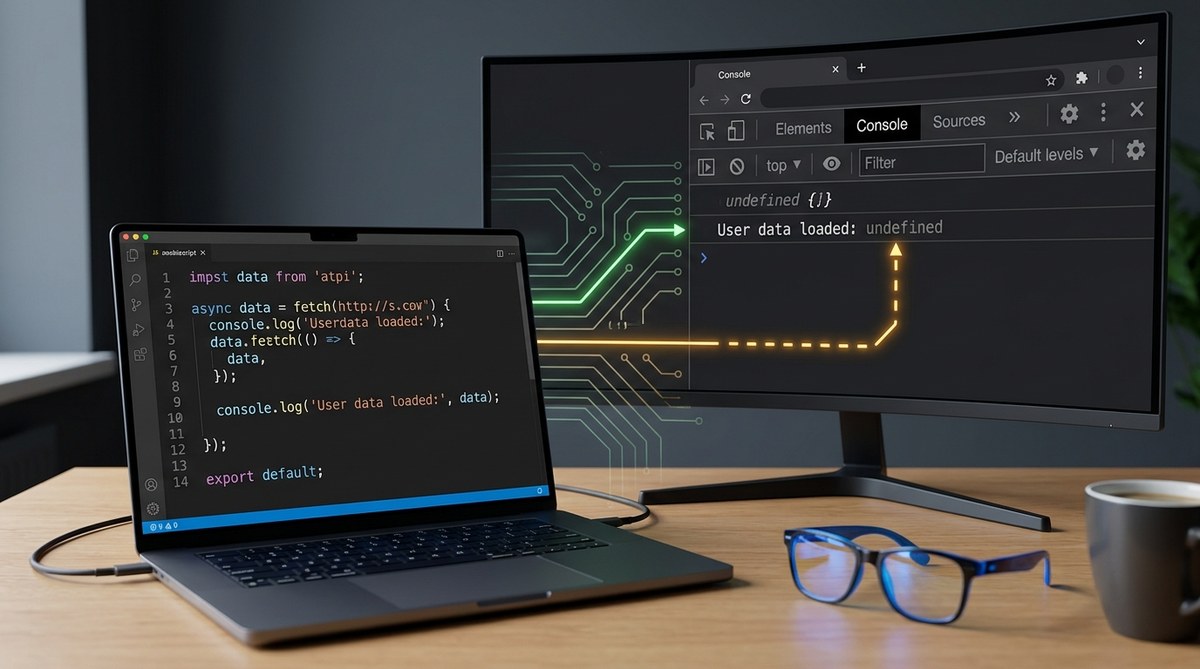
Async Code and Execution Order
console.log placed after an asynchronous operation might run before the data is available. If you log a variable that is set inside a setTimeout or a fetch callback, the log at the top level will show undefined.
let data;
fetch('/api').then(res => res.json()).then(d => data = d);
console.log(data); // undefined
Move the log inside the .then chain. Or use async/await and place the log after the await.
If you are using console.log inside a loop or a requestAnimationFrame, ensure the code path is reached. Use console.trace() to see the call stack when the log executes.
Service Workers and Background Scripts
Service workers run in a separate thread. Their console.log calls do not appear in the main page console. You must open the Service Worker console instead.
In Chrome: go to chrome://serviceworker-internals, find your worker, and click “Inspect”. A dedicated DevTools window opens. All logs from that worker appear there.
The same applies to Web Workers and SharedWorker. Check the dedicated context in the Sources panel.
Overwritten console.log
A script or library on your page might have replaced console.log with a no-op function. This is more common in production environments where developers want to strip logs.
Type console.log in the console and press Enter. If it returns function () {} or something other than function log() { [native code] }, it has been overwritten.
To restore it temporarily, run:
console.log = window.console.log.bind(console);
But if the override happens after this line, you need to find the source.
Conditional Execution Based on Environment
Many build tools (Webpack, Vite, Rollup) remove console.log calls in production bundles through tree shaking or plugin configurations. If you are running a built version of your app, check that the NODE_ENV is not set to production.
Look for a .env file or build script that defines process.env.NODE_ENV. If you want logs in production, you need to configure your bundler to keep them or use a dedicated logging library.
Browser Console Persistence and Session Issues
Sometimes the console itself acts up. The “Preserve log” checkbox (usually above the console) must be checked if you want to see logs that were printed before a page navigation. If your page reloads quickly, you might miss the logs.
Also, try clearing the console with the clear button and then refreshing the page. Old filters or a hidden error message can cause confusion.
Debugging Checklist
Follow these steps in order when console.log not showing:
- Open the Console and set the log level to “Verbose” or “All”.
- Add a simple string log at the top of your script to verify the file loads.
- Open an incognito window with no extensions and test again.
- Check the Network tab for failed script loads.
- Inspect the call stack with
console.trace()if the log runs conditionally. - Search for overwrites by typing
console.login the console. - Look at your build config if you are using a bundler.
- Open the Service Worker console if you use workers.
- Restart the browser and reset DevTools settings to default.
“I have seen developers waste an hour because they had a filter set to ‘Errors only.’ Always start with filters. That one step saves more time than any other.” — Sarah Chen, senior front-end engineer at a major e-commerce company.
When to Use Console Alternatives
Sometimes the best fix is to stop relying on console.log. For structured debugging, use these methods:
| Use case | Better tool |
|---|---|
| Inspect an object | console.dir() or console.table() |
| Trace execution path | console.trace() |
| Count occurrences | console.count() |
| Measure time | console.time() / console.timeEnd() |
| Group related logs | console.group() / console.groupEnd() |
Also consider using breakpoints in the Sources panel. They give you full control over execution without trusting a log statement.
Understanding the Real Root Cause
The issue of console.log not showing often points to a misunderstanding of execution context, environment, or tooling. Once you recognize the patterns, you will solve it in under a minute. For deeper related problems, check out our guide on Common JavaScript Debugging Tricks Every Developer Should Know. If your issue involves network requests that fail silently, see Why Your Network Requests Are Failing and How to Fix Them.
Keep your DevTools updated. Browsers change filter defaults and UI often. A quick habit: whenever a log does not appear, first toggle the filter dropdown. It sounds trivial, but it saves more debugging time than any other single action.
Next time your console stays blank, you will know exactly where to look. Start with filters, then verify execution, then check extensions and workers. You have got a clear path now. Happy debugging.